The main areas of the terminal
In the default trading layout, you will usually work with five areas:- The top navigation bar
- The market header
- The chart and chart tools
- The trade panel on the right
- The bottom activity panel for balances, positions, orders, and history
Top navigation bar
The top bar is the terminal-level navigation. It is always visible and helps you understand where you are in the product.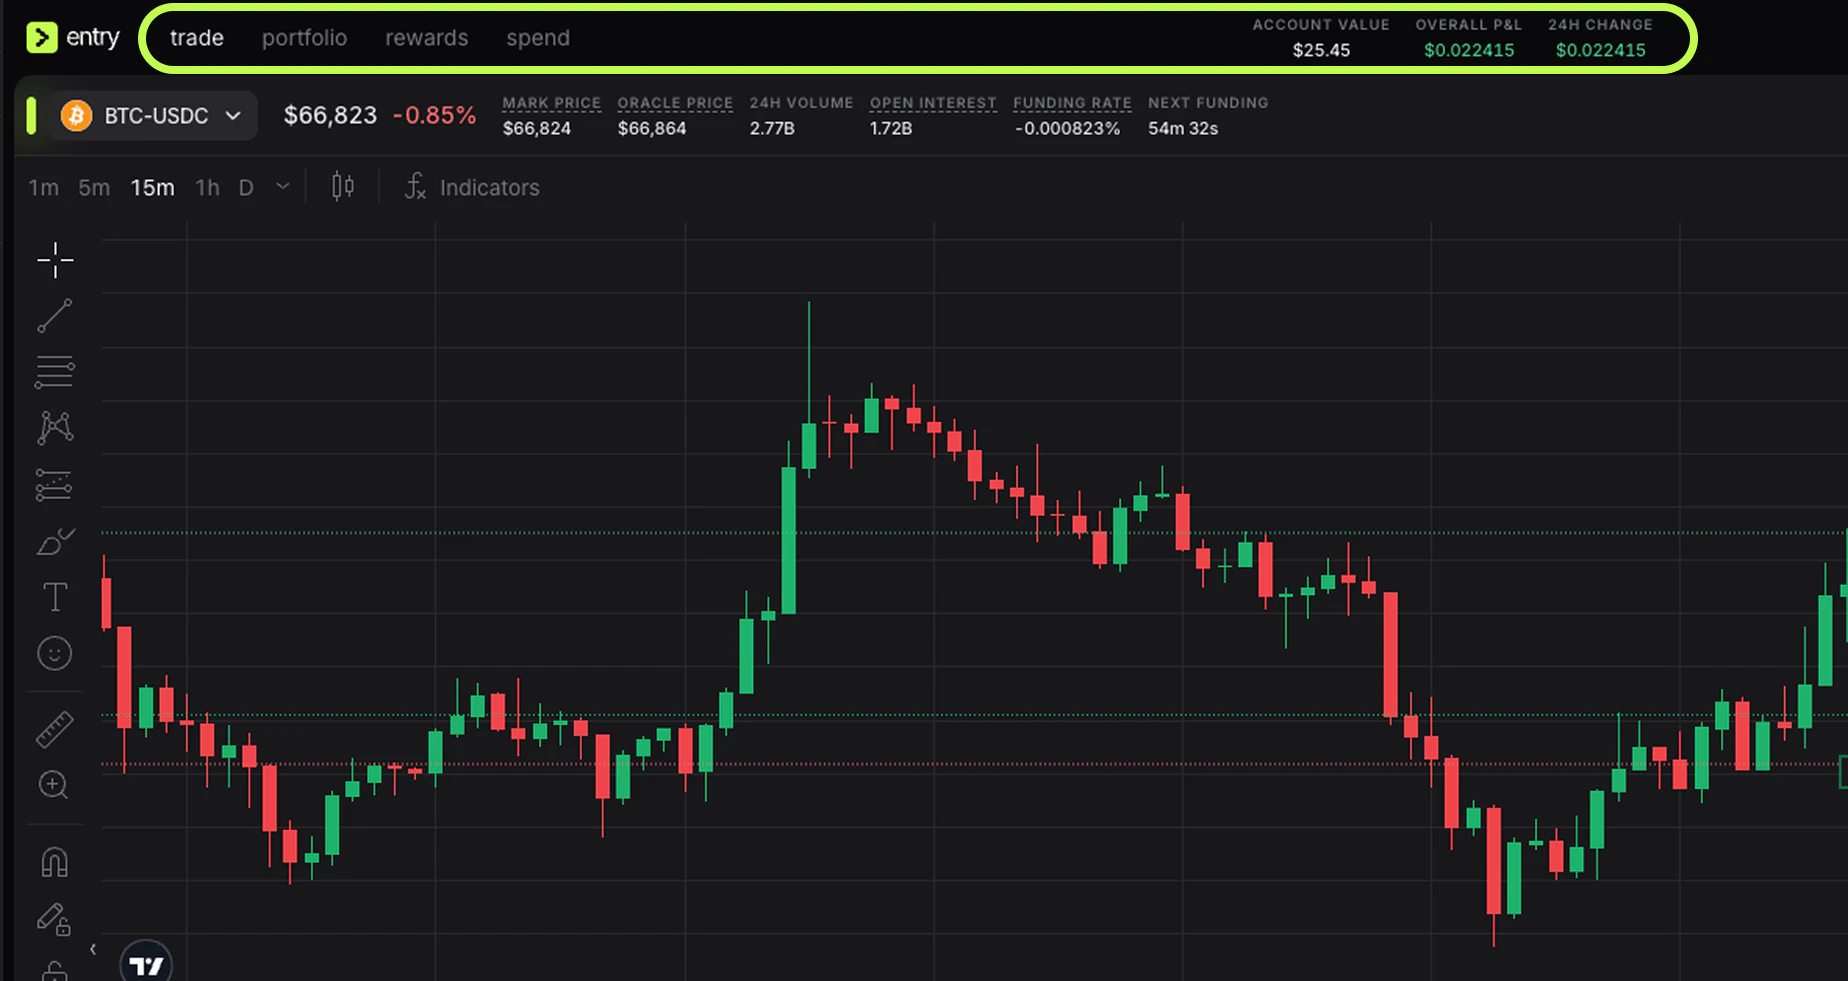
- trade: the active trading terminal
- portfolio: a wider account view with equity, PnL, and open positions
- rewards: rewards-related area
- spend: spending-related area
- Account Value, Overall P&L, and 24H Change: a fast summary of account performance
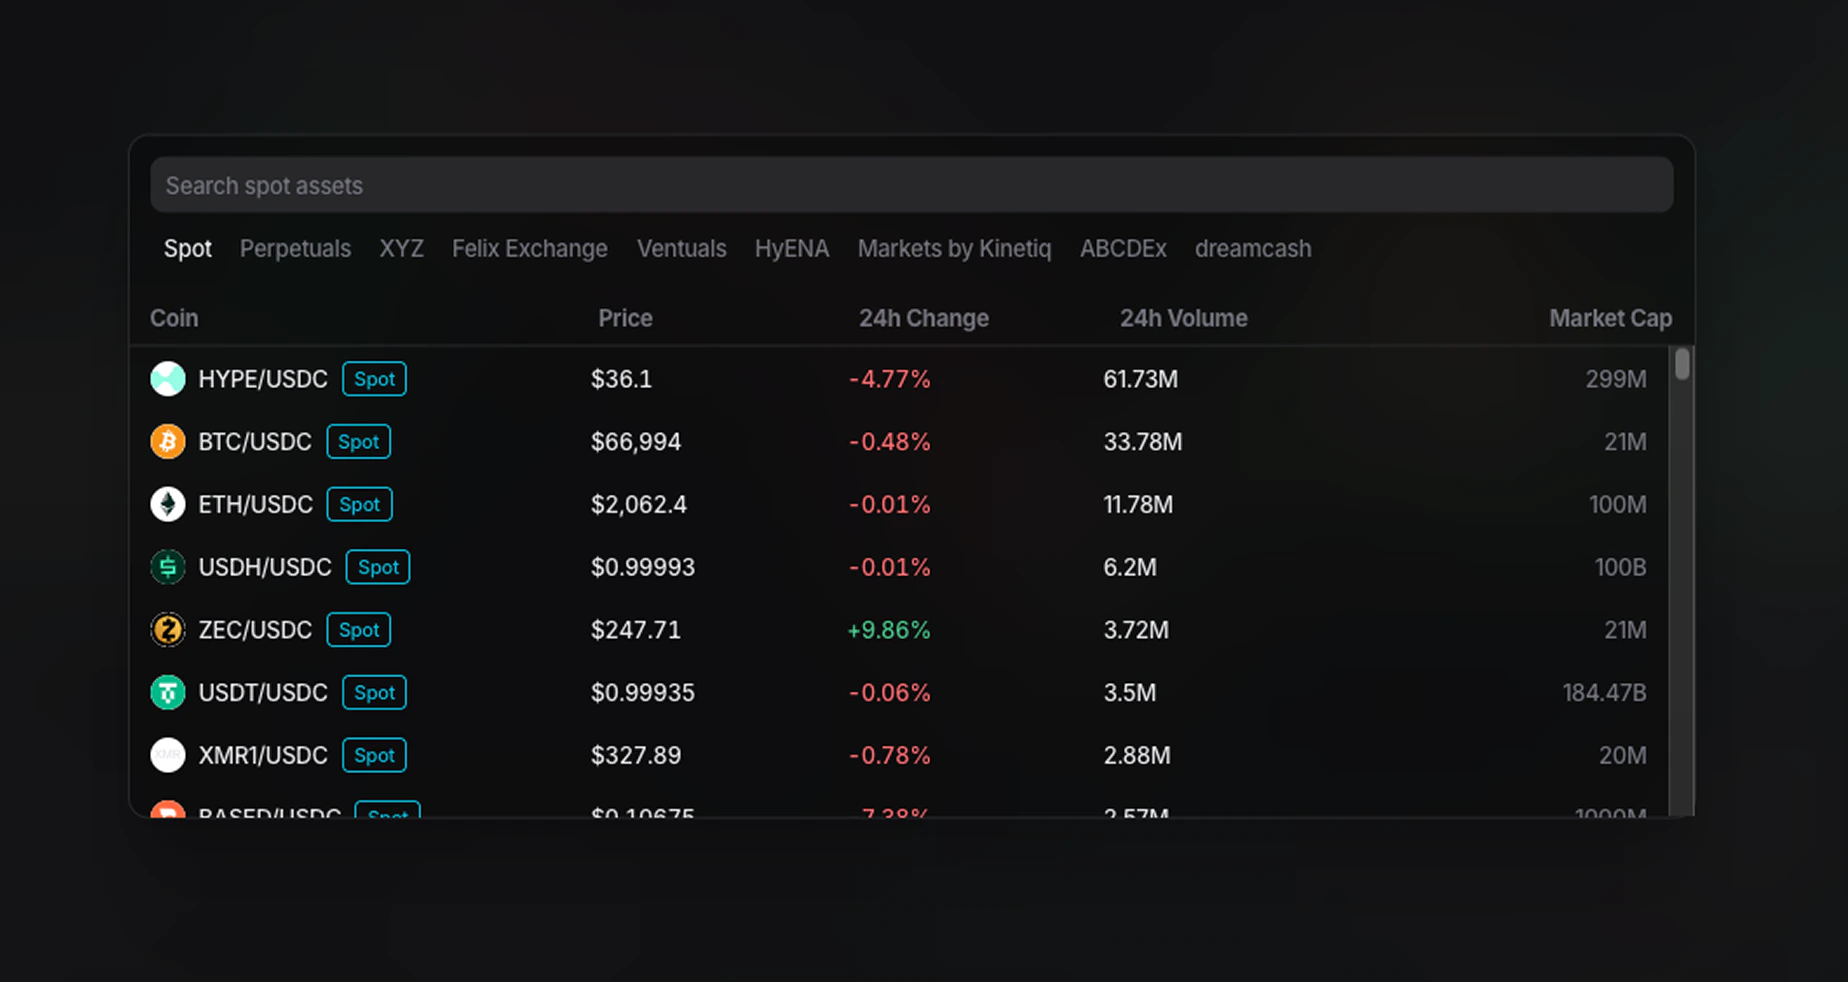
Market selector and market stats
The top-left section above the chart is where you choose what to trade. You can click the current pair, such as BTC-USDC, to open the market list. The market picker includes:- a search bar for perpetual assets
- tabs such as Spot and Perpetuals
- exchange or source filters
- market rows with Price, 24h Change, 24h Volume, 8h Funding, and Open Interest
- current price
- daily percentage move
- Mark Price
- Oracle Price
- 24H Volume
- Open Interest
- Funding Rate
- Next Funding
Chart area
The chart is the center of the terminal and the main area for reading price action.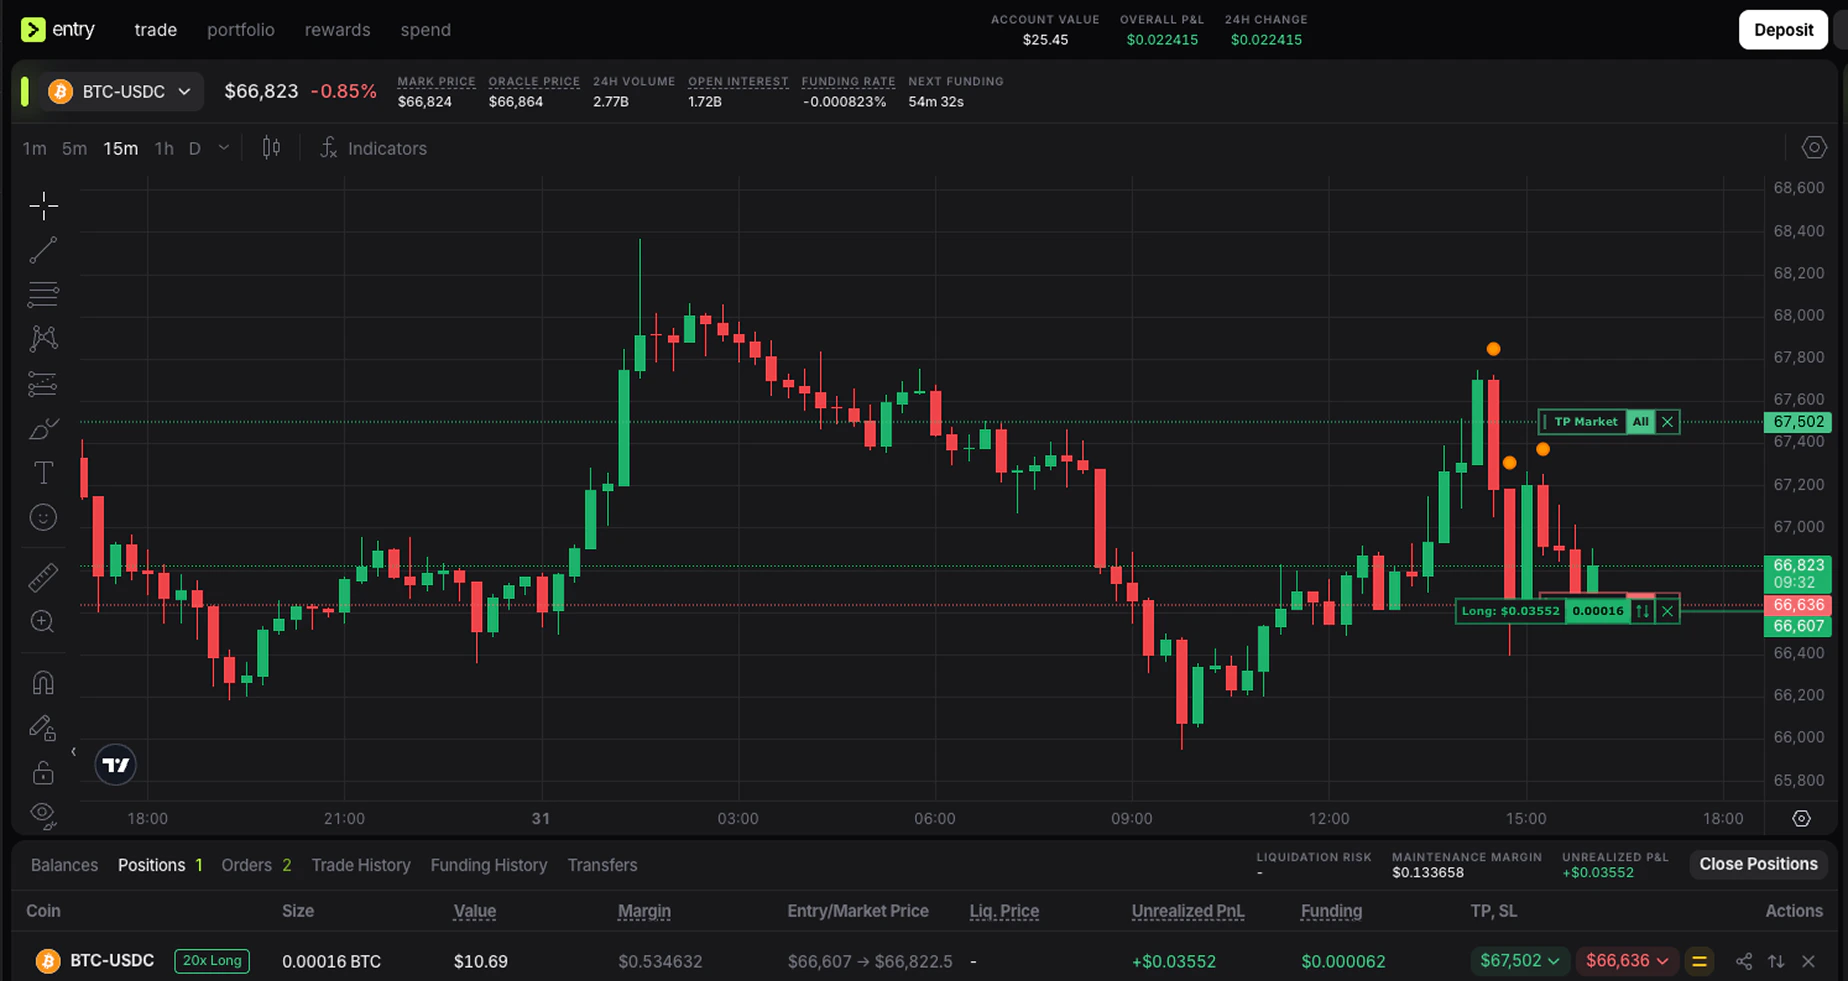
- timeframe shortcuts such as
1m,5m,15m,1h, andD - a timeframe dropdown for more intervals
- chart type selector
- Indicators
- TradingView drawing and annotation tools on the left
- the live price scale on the right side of the chart
Timeframe selector
The timeframe buttons change how much price detail you are looking at. Shorter intervals such as1m and 5m are more useful for execution and fast trading. Higher intervals such as 1h and 1D are better for broader market structure.
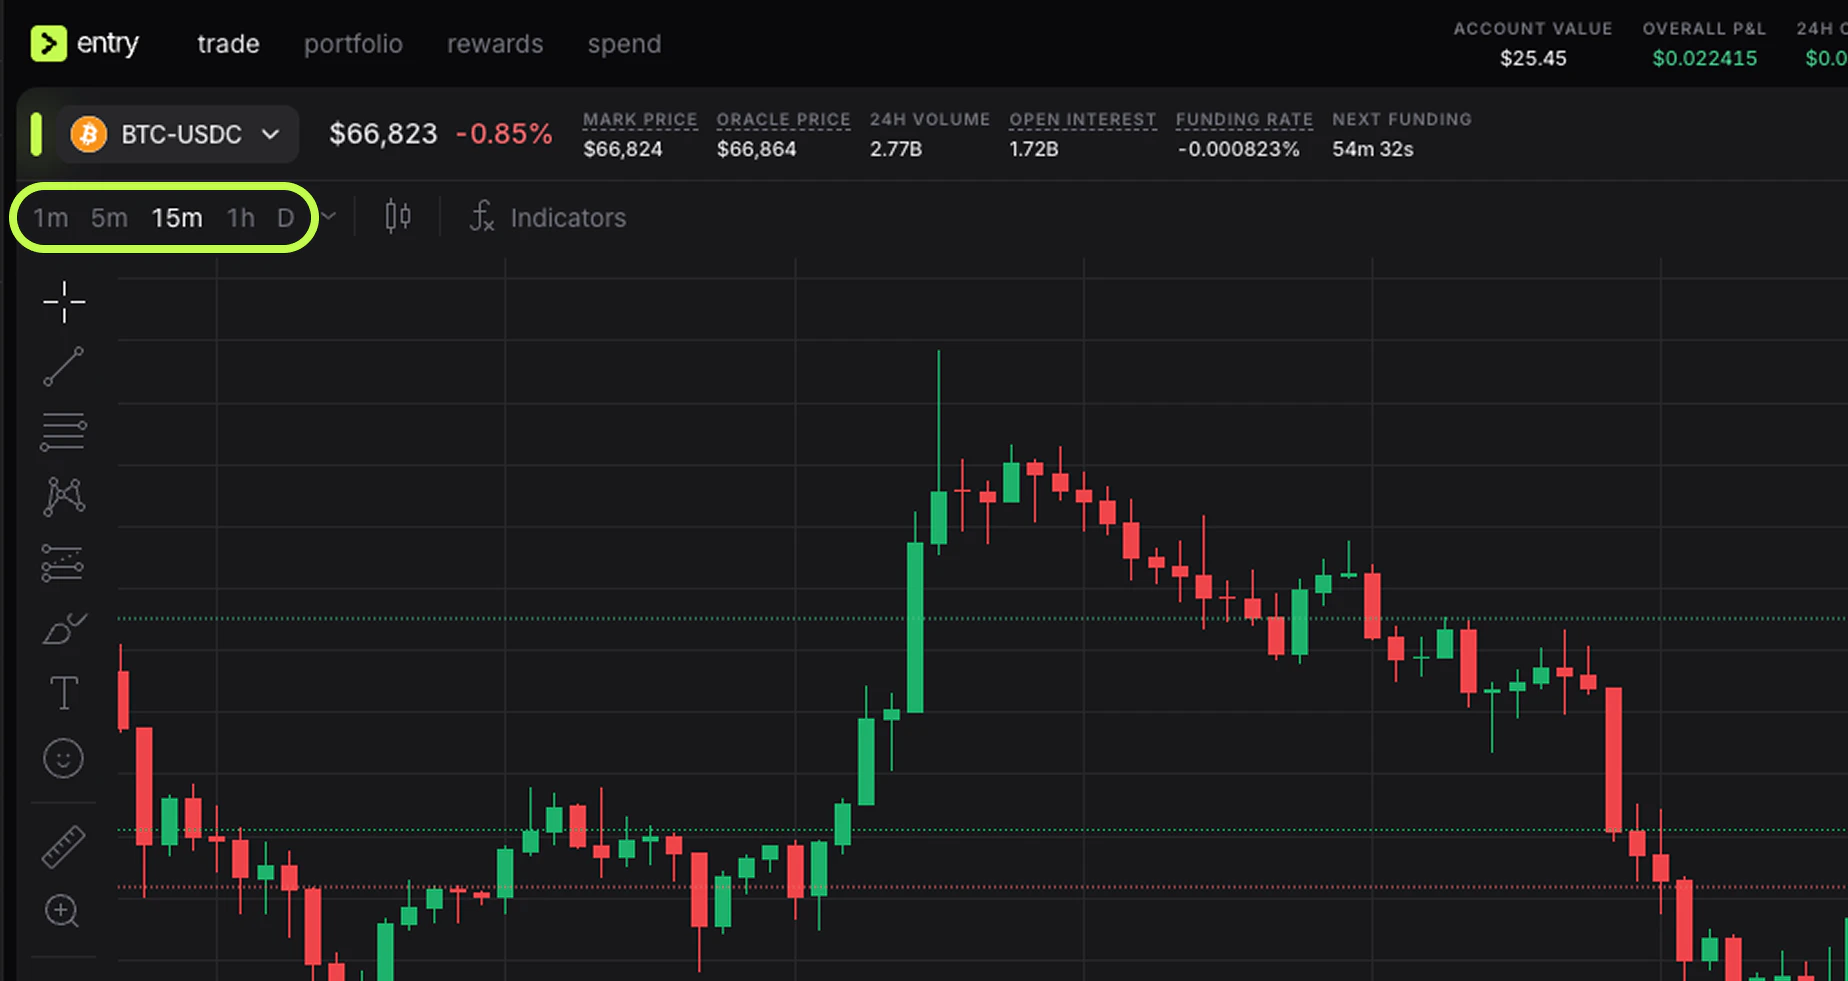
- use 1h or 15m to understand the broader direction
- use 5m or 1m only for fine-tuning entry timing
Chart type selector
The chart type menu lets you switch between visual styles such as candles, bars, line, area, and Heikin Ashi.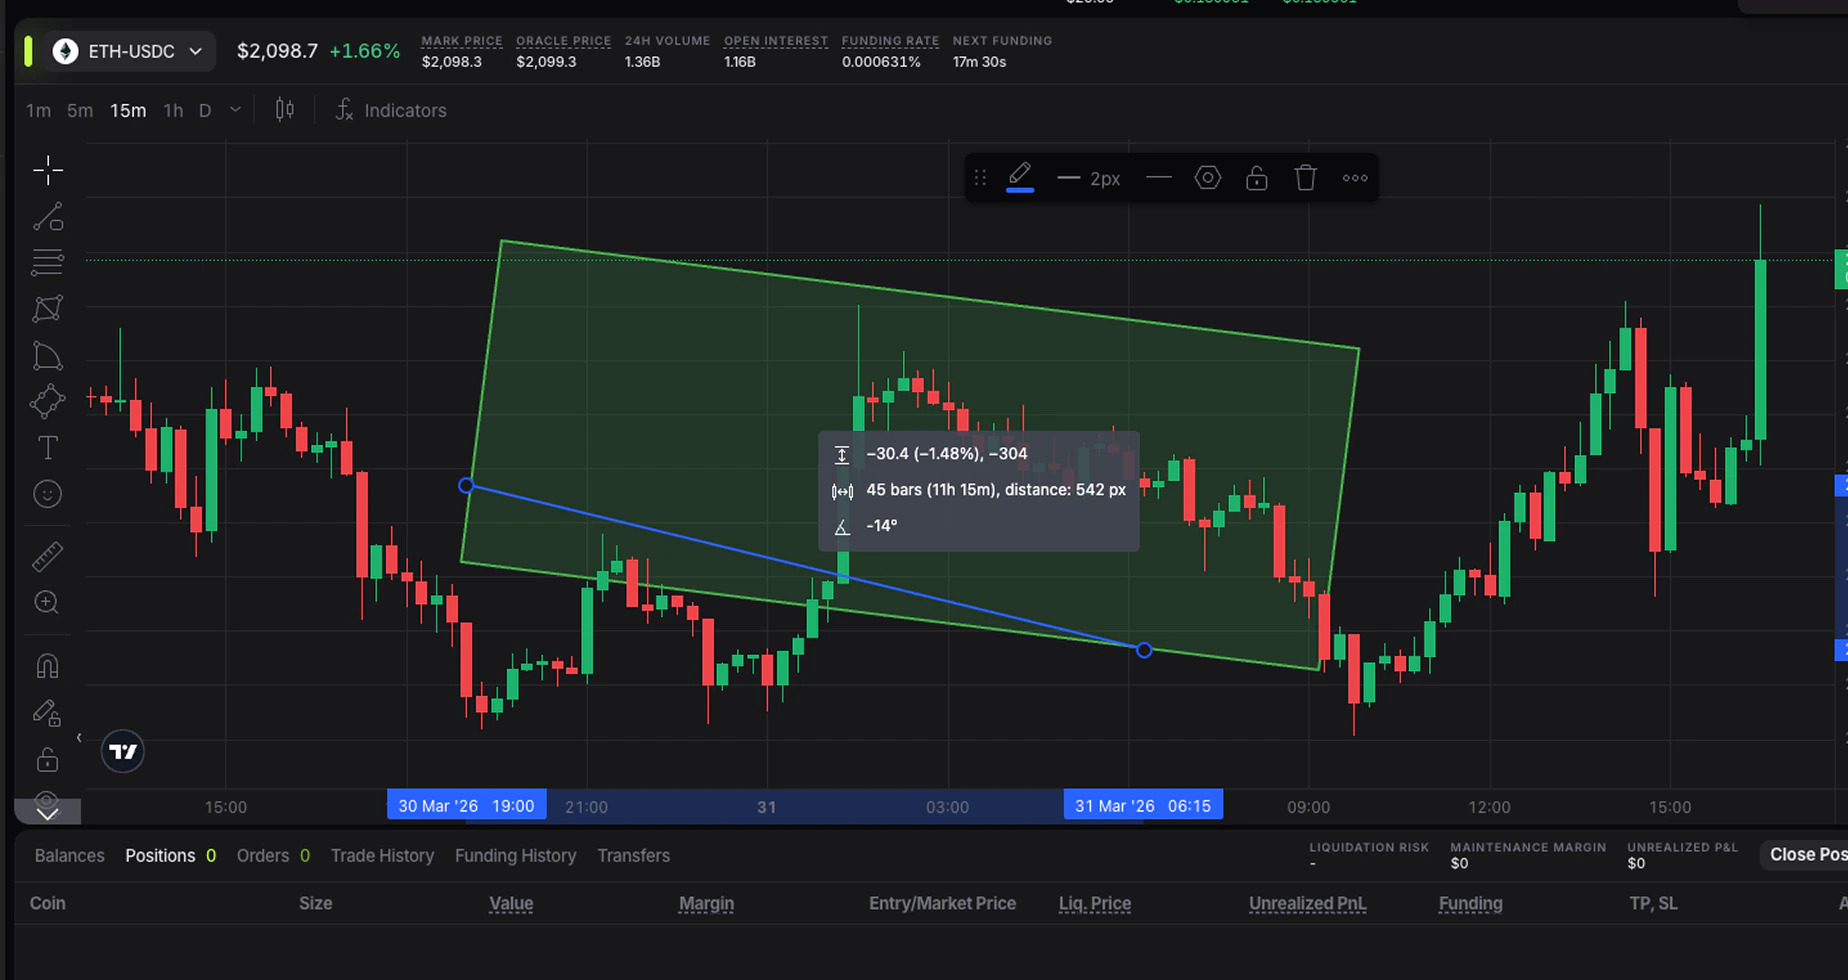
- Line is cleaner if you only want to follow broad direction
- Heikin Ashi can make trends easier to read, but it smooths real price action
- Bars and Hollow Candles are preferred by some more experienced chart readers
Indicators
The Indicators menu opens the TradingView indicator library. This is where traders add tools such as moving averages, RSI, VWAP, or volatility-based studies.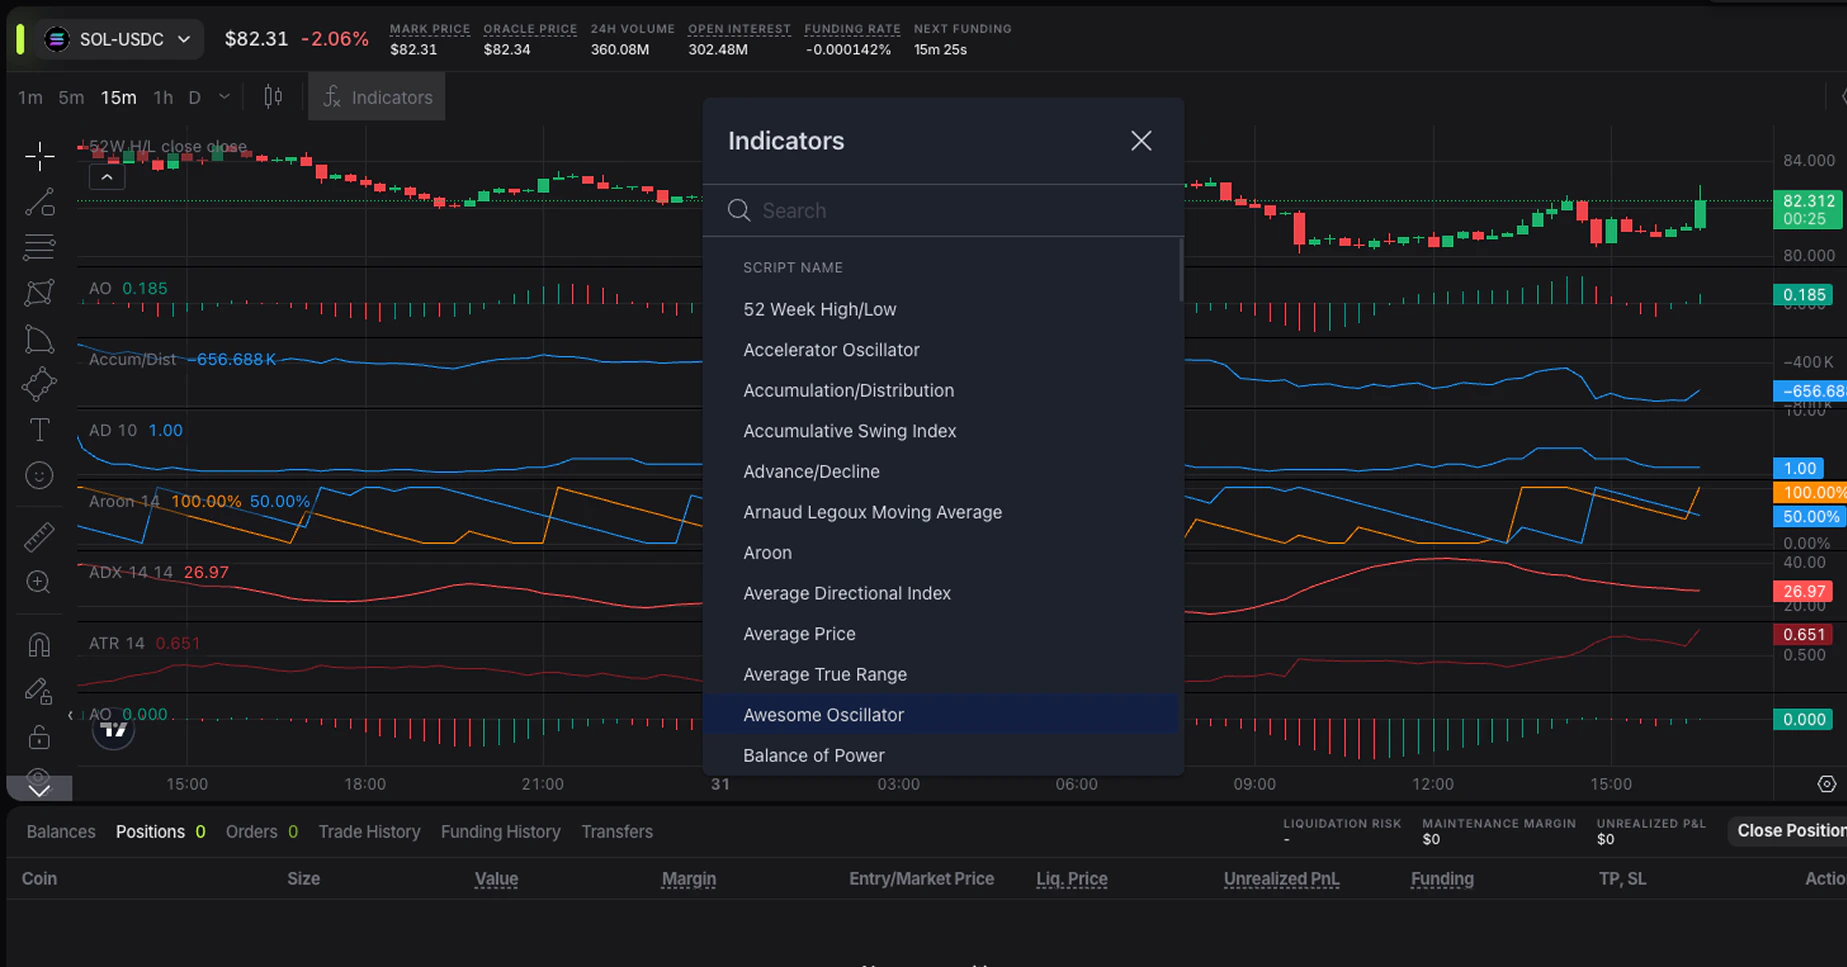
Drawing tools
The left-side toolbar contains drawing tools from TradingView. These are useful for:- trend lines
- support and resistance zones
- horizontal levels
- measurement tools
- annotations
Position markers directly on the chart
One of the most practical parts of the Entry Finance interface is that your live position and attached exit levels are visible directly on the chart.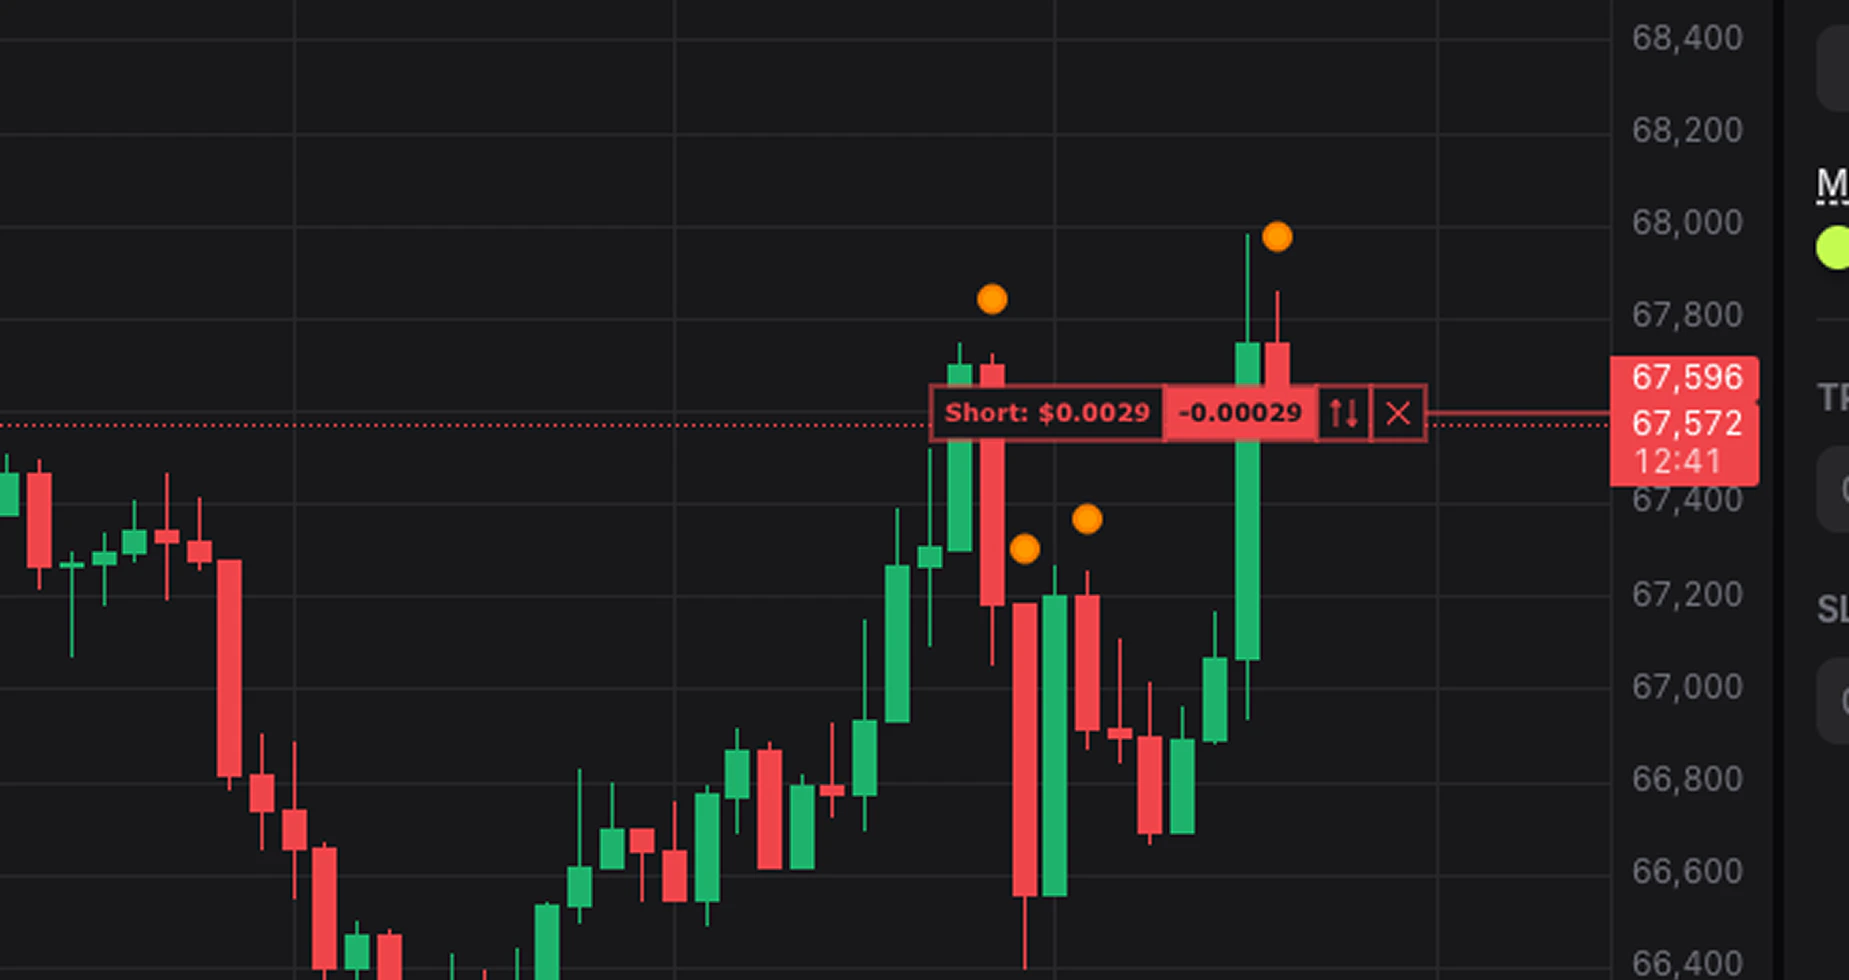
- the position label, for example Long
- current PnL on the chart
- position size
- take-profit and stop-loss lines
- quick controls such as TP Market, All, and close icons
Trade panel on the right
The right sidebar is where you build and send the trade.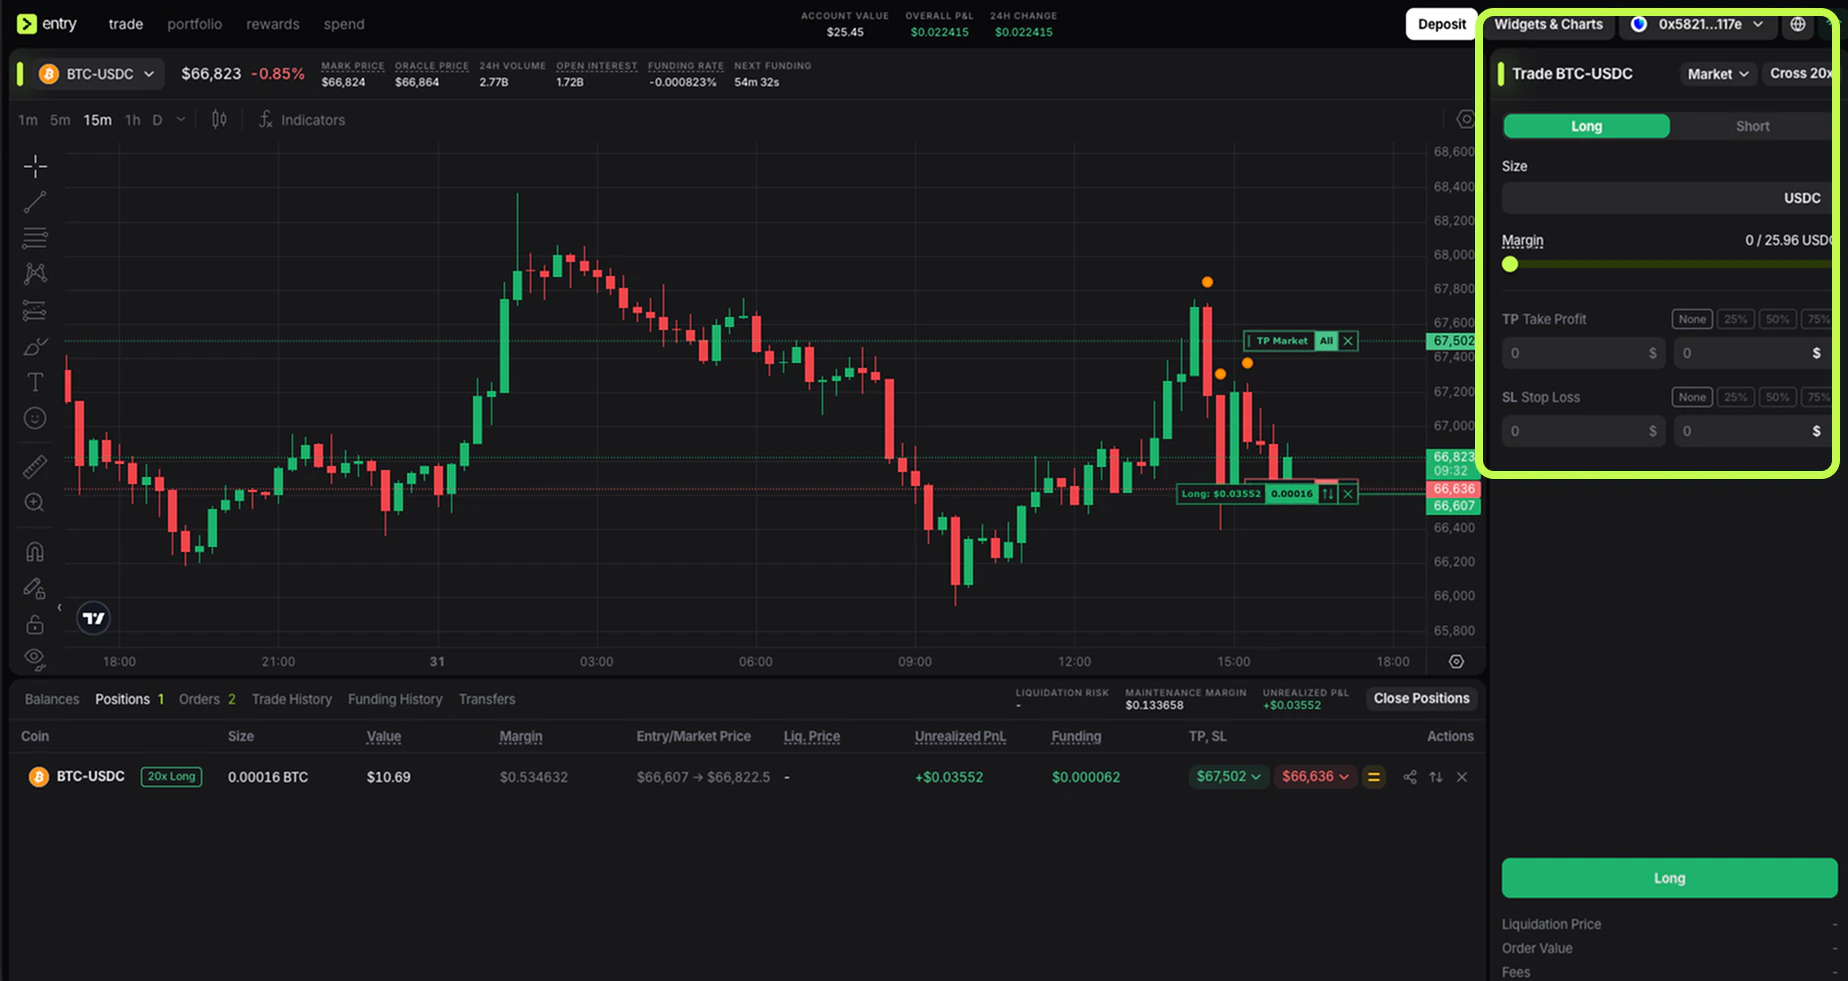
- the selected market name
- order mode selector, such as Market
- margin mode and leverage display, such as Cross 20x
- Long and Short toggle
- Size input
- margin usage bar
- Take Profit inputs and quick percentage buttons
- Stop Loss inputs and quick percentage buttons
- the main submit button
- trade summary fields near the bottom, such as liquidation price, order value, and fees
Long / Short toggle
This is where you choose direction:- Long means you profit if the price rises
- Short means you profit if the price falls
Order type and leverage
At the top of the panel, you can choose the order mode and see the current leverage setup. In your screenshots, the panel shows Market and Cross 20x.- Market sends the order immediately at the best available price
- Cross means your position uses the broader account margin rather than isolated margin for only that one trade
- 20x shows the selected leverage multiple
Size and margin bar
The Size field is where you define how large the trade will be. The margin line below it shows how much margin the trade uses relative to what is available in the account. This is one of the most important risk controls in the terminal.TP and SL fields
The panel includes dedicated Take Profit and Stop Loss sections with quick preset buttons. This is a strong workflow improvement because it encourages users to define exits before or immediately after entry.- Take Profit locks in gains if the market moves in your favor
- Stop Loss limits downside if the setup fails
Bottom panel: balances, positions, orders, and history
The lower panel is where you monitor what is happening in your account after the order is placed.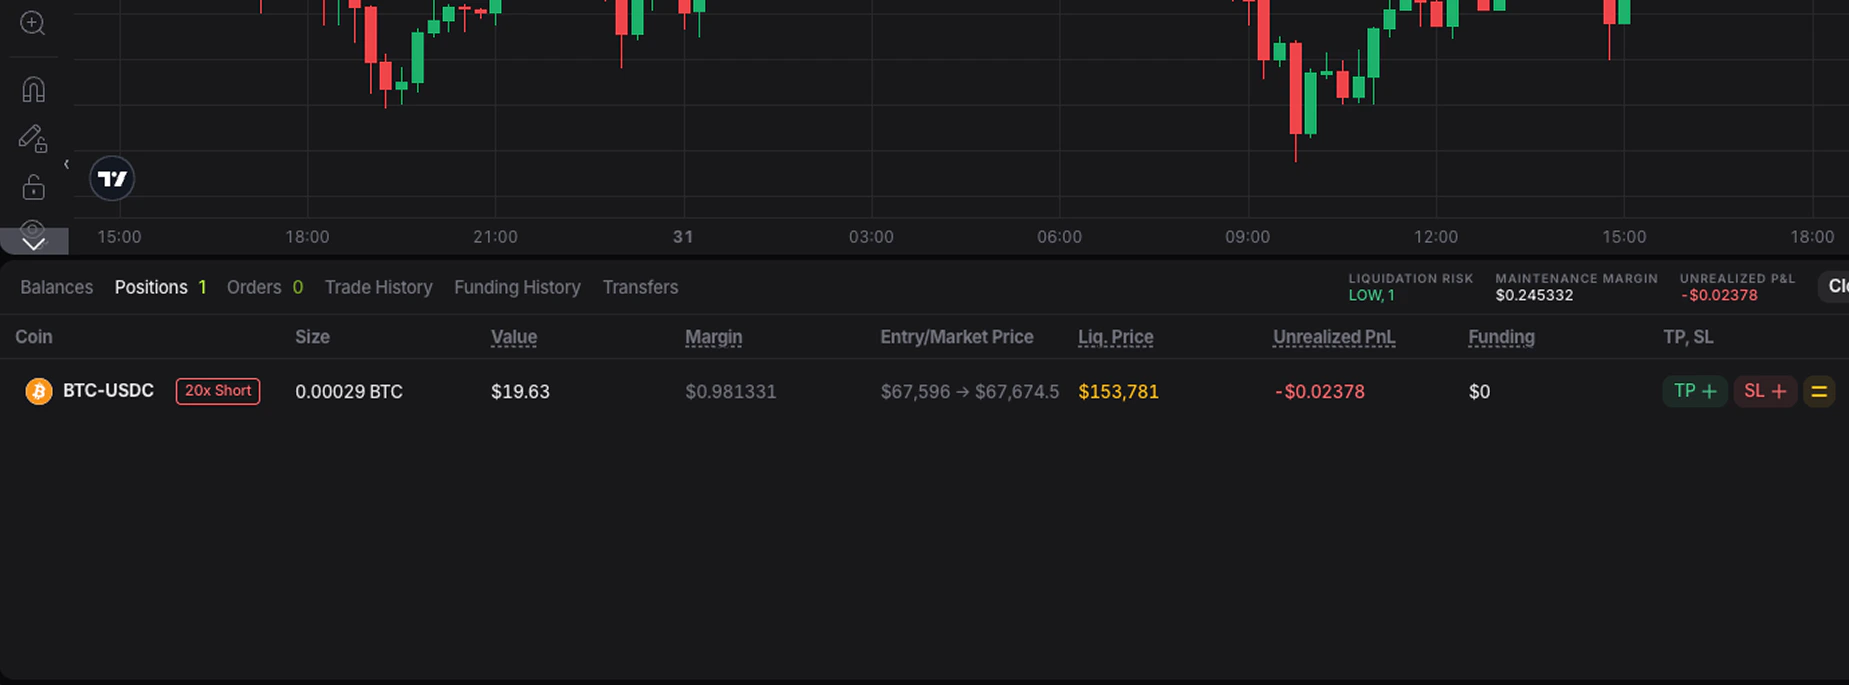
- Balances
- Positions
- Orders
- Trade History
- Funding History
- Transfers
Balances
The balances tab helps you understand what capital is available. This is especially important because Entry separates the trading workflow from simple wallet-style thinking. What matters is not just what you own, but what is available for the type of trading you want to do.Positions
The Positions tab is where you monitor live exposure. In the current interface, position rows include data such as:- coin
- direction and leverage badge
- size
- value
- margin
- entry price and current market price
- liquidation price
- unrealized PnL
- funding
- TP / SL
- action controls
Orders
The Orders tab shows instructions that are active or waiting to be filled. This is critical because an order can become a live trade even if you are not currently in a position yet. If you use limit entries, staggered exits, or protective orders, this tab becomes part of your active risk management.Trade history, funding history, and transfers
These tabs help explain changes in your account after execution:Trade Historyshows filled tradesFunding Historyshows funding payments or receipts on perpetualsTransfersshows money movement into or out of the trading account
Portfolio tab
Although the default trading screen is where execution happens, the Portfolio tab is also part of the overall terminal experience.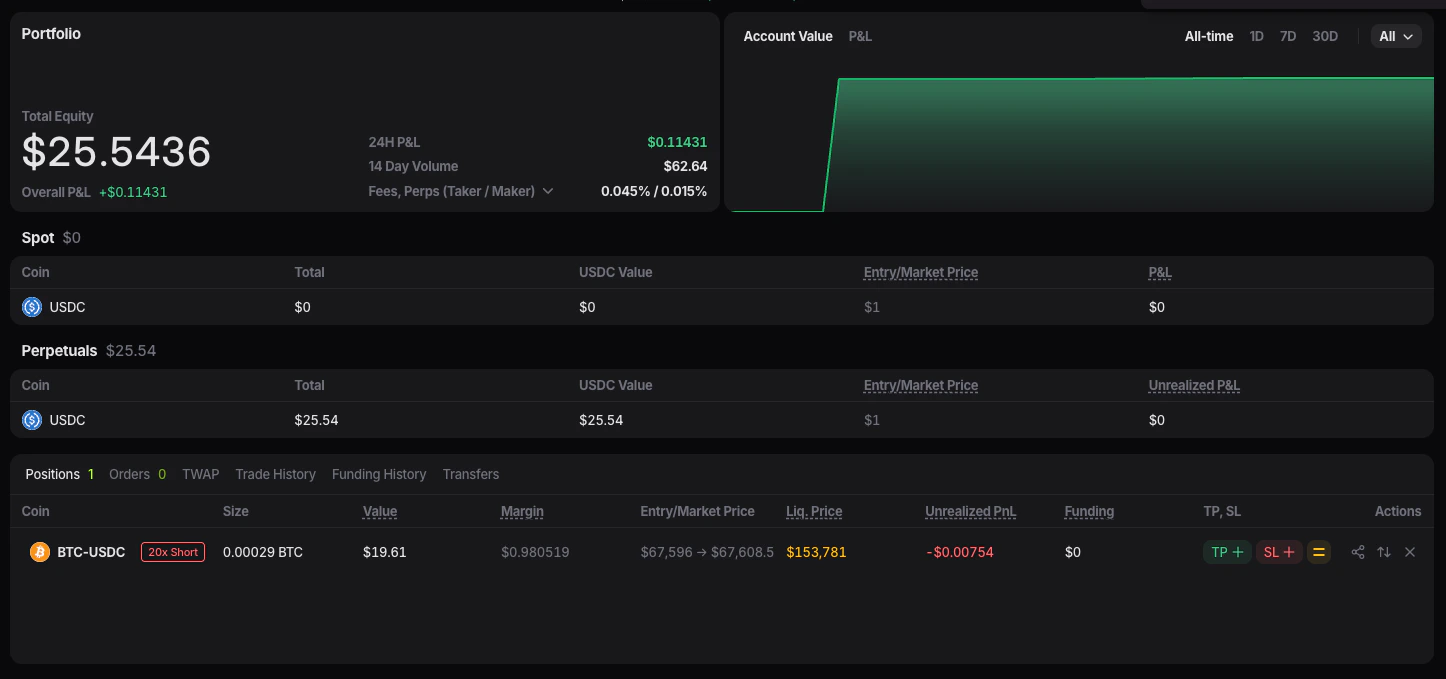
- total equity
- 24H PnL
- account value chart
- spot and perpetual balances
- open positions and orders
- use
Tradewhen you want to analyze, enter, and manage positions - use Portfolio when you want to review equity, balances, and account performance
Widgets and layout controls
The Widgets & Charts button in the top bar suggests that the terminal is not limited to a single fixed layout. This is important because more advanced traders often want different workspace setups depending on their strategy. In practice, layout controls matter for three reasons:- they help active traders keep the most important panels visible
- they reduce clutter for beginners
- they make it easier to add supporting widgets such as extra charts or market tools
How to read the terminal as one workflow
The easiest way to understand Entry is not as a collection of separate panels, but as a trading sequence:- Choose a market from the pair selector
- Read the market header for price, funding, volume, and open interest
- Use the chart to understand structure and timing
- Build the trade in the right panel
- Monitor the live trade through chart markers and the bottom positions tab
- Review fills, funding, and transfers in the history tabs